
By César A. Hidalgo
*No AI was used to write this post.
What happens when you run an AI generating paper with an AI reviewer in a loop? And what does this mean for our future as researchers?
Most scholars are familiar with web based AI tools, like Chat GPT, but fewer have explored the use of command line AI tools like Claude Code.
Much of the public conversation about AI focuses on chat interfaces like ChatGPT. But a quieter revolution is happening in command line AI systems such as Claude Code or Codex. Unlike chatbots, these systems can act autonomously. Given a goal, they can download data, write code, install software, run analyses, and generate figures, working like a research assistant in a can.
When we pair these “research assistants in a can” with AI reviewer systems, we can explore what happens when feedback cycles that traditionally take months collapse into hours. This is leading to a new type of research workflow, one producing what I call AI generated papers, or AIGPs.
To explore this idea, I did exactly this. placed a CLI AI tasked with writing a paper in a loop with an AI reviewer.
My conclusion is that an AI tsunami is approaching the sciences, and while some researchers are running towards the wave with their surfboards, many are still sleeping on the beach. This essay is an attempt to explore this emerging technology using a hands on example, using this as an opportunity to reflect on what it means to be a scholar while sounding the tsunami alarm system.
Making A Simple AIGP
On the morning of February 28, I began working on an AIGP focused on estimating the GINI index, not of a country’s income or wealth distribution, but of impressions earned by social media posts.
My motivation came from the idea that people might make strategic choices depending on their expectation of attention inequality. Influencers might bet for winner-take-all platforms, like X or TikTok, while those looking to connect with peers might focus on platforms where they expect attention to be less unequal, like LinkedIn.
I began discussing this project with Claude on the command line. Claude began planning and after several minutes came up with a few clarifying questions and requests. This led me to realize that comparing multiple social media platforms would require registering for multiple APIs, so I narrowed down the effort to attention inequality on X. X had a straightforward API that we could access, so I bought 200 dollars in API credits and got started.[1]
In this process Claude also identified a twitter dataset from EPFL—a Swiss university—with data from the early to mid 2010s. It downloaded the data, generated the scripts to clean it, analyze it, and produce figures for the paper.
This began an iteration loop. Each time Claude produced a new version, I looked at it and gave “him” some feedback. Sometimes, I looked at the draft in passing, and other times, I printed it and read it in detail. Those longer revisions could send Claude back to work for a few hours. Eventually, we arrived at this draft which I submitted to reviewer3.com, an AI-review system being developed by a San Francisco startup.
This is where I began venturing into uncharted territory.

Claude had produced a paper focused on five stylized facts using the EPFL data plus two samples of recent tweets gathered from X. A cross-section of 8,722 tweets and a timeline panel of 17,671 tweets from 225 users.
The first fact was that attention inequality on X was huge, with the GINI of impressions being around 0.97. This is much higher than that of the most unequal economies in the world, like South Africa, with a Gini of around 0.6. It is like splitting a pizza with 100 slices by giving 97 slices to one person and asking 99 people to share the other 3.
Second, the relationship between followers and impressions is convex, meaning that impressions are less than proportional to followers.[2] This convexity, however, is less pronounced for accounts with more followers, so for larger accounts impressions grow more hand-in-hand with followership than in less popular accounts.
Third, retweet inequality has increased over time. GINI estimates obtained from the EPFL archive were 0.76 for 2012 to 0.89 in 2018 (this comparison is problematic, and we will get to that later).
Fourth, follower inequality decreased across this same time period (also a finding that is a bit problematic).
And fifth, total impressions are well approximated by a model using follower counts, likes, retweets, and quotes (R-squared=82%).
But what did the AI reviewer make of this?
While many scientists have explored getting feedback from a web-based AI tool, fewer have explored using dedicated products, like reviewer3.com. These are systems where different AI agents evaluate the paper, resulting in feedback that in my experience is better and more technical than the one you get by uploading a paper to Gemini or ChatGPT.
In some ways, AI-review systems are similar to traditional forms of peer-review. You upload a manuscript and they “destroy it.” The key difference it is that they do it much faster. Meaning that you get reviews back in minutes instead of months.
So, what did Reviewer 3 had to say about this paper? [Here is a link to the review]
Here are some core issues it mentioned.
One was the notion that the EPFL data could not be readily compared with our X sample. The X sample was generated by searching for common words like “the,” to obtain a sample of English language tweets. The EPFL data, however, had no information on the text of the tweets, so we couldn’t filter it in the same way and make these samples truly comparable.
The AI-review also mentioned that the panel sample from X over-represented large accounts, and this could bias the regression used to generate fact number five.
Overall, these were good and constructive criticisms. So, I asked Claude to add them to the paper and write a response letter.
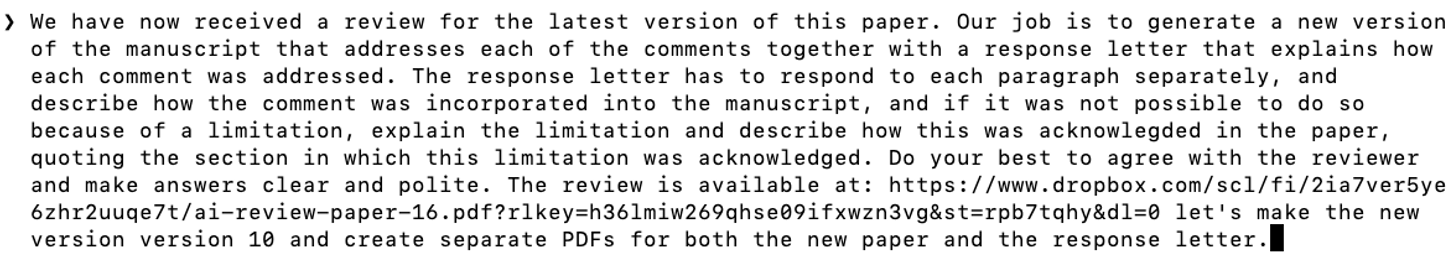
This led to a new version of the paper and a response.
For the first set of comments, Claude acknowledged the lack of comparability as a limitation. This was already in the paper, so it was a matter of emphasis at this point.
For the second comment, it re-estimated the regression using only the unstratified cross-section sample, showing that the quadratic term persisted, albeit it became smaller. This meant the time series data was not solely responsible for the observed convexity.
Then I uploaded the new version of the manuscript to reviewer3.
This is where the loop began. Unlike a human reviewer, who can compromise when the authors explicitly acknowledge a limitation in a manuscript, the AI did not budge. It latched on to the neck of its victim suggesting an entire set of over 20 new suggestions which I passed on to Claude.
This started an interesting loop. The AI-reviewer kept on raising issues and Claude kept on revising the paper. The result was a paper that kept on getting longer and longer.
The AI reviews were useful, but the process was even more illuminating about human peer-review. The loop got me thinking about the importance of having a stopping criterion and what I’ve began “strategic forgiveness.”
Strategic forgiveness is the idea that authors and reviewers enter implicit deals based on their common understanding of a field. We have a shared sense of what is reasonable, so reviewers push authors to address the comments that can be addressed and forgive shortcomings, when these are properly acknowledge, for those “unsolvable” problems. This helps fields move forward in a way that is differential. Fields where high standard of proofs are possible can demand different standards than fields where collecting even the simplest forms of data is extremely challenging.[3]
So, where does this exercise leave us? How our careers might change in a world where AI can generate papers and review them?
Scholars in a world with AI
In 1957, William Shockley, a Nobel laureate and one of the inventors of the transistor, published a simple mathematical model explaining differences in productivity between researchers. The model was based on the idea that scholars need to be good at several complementary tasks. A good scholar must be creative, good at math, writing, graphic design etc. If a scholar’s ability to execute a task k is r(k), then their output is a product of how good they are at each of these skills (Output=r(1)r(2)r(3)….r(N)). This model, which was later rediscovered in economics by Michael Kremer, is known today as a weak-link or O-ring model.[4]
Weak-link models formalize the idea that output is constrained by what an individual, firm, or economy is worst at (the weak link of the production chain).
In a world where a scholar can team up with AI, they can allocate tasks to themselves, or to the AI, in a way that minimizes this constraint. For example, a scholar that is not good at making plots can substitute that skill with AI. Overall, this tide should raise all boats, but also, it makes research more intense while shifting the skills that determine who becomes a top scholar.
This is a challenge for scholars relying on tasks that AI is good, while those that have skills that are complementary, or foreign to an AI, can gain an advantage.
Some of these foreign skills are field specific and obvious. An anthropologist who travels deep into the jungle to connect with an uncontacted population is doing something that no AI can do.
Other skills are more general and fall into what we might call broadly a “sense of taste.”
In a world where ideas are easier to execute, the value of good ideas increases. AI thrives in the hands of humans with good judgment. So, scholars with a good intuition and ability to debug results from output should do well in this world.
Now, it is easy to snub AIGPs as low tier research. After all, a paper estimating inequality of attention on X can be considered low tier. But we need to be careful about generalizing from this example.
A core tenet of Clay Christensen’s disruptive innovation theory is that disruption comes from technologies that start by being worse. Digital photography started by being awfully pixelated. Yet its trajectory allowed it to displace chemical photography. The point is that, when we compare technologies, we need to think of rates of change, not levels. The level of AI generated research can be low today, but its slope looks steep.
Three years ago, filmmakers snubbed AI generated video and until recently, vibe coding was a dirty word. Today AIGPs may seem like a joke. But the question is not what type of research AI can do today, but what research it will be able to do in fifteen years. In some fields, like mathematics, there are already a few bright examples, like Claude helping solve long standing problems for Bartosz Naskręcki and the legendary Donald Knuth.
So, will AI make our lives as researchers easier. I doubt it. In a world where the use of AI is increasingly more common the treadmill just keeps on running faster. The net effect is unlikely to be an increase in leisure, but an increase in competition and intensity.
So why I am running towards the tsunami with a surfboard? Because whether I am sleeping on the beach or running towards the ocean, the tsunami is coming. The question is not whether AI will change science, but whether we will learn to ride the wave.
ENDNOTES
[1] I only used personal funds for this project, for both X API and Claude credits.
[2] e.g. impressions grow like followers^a with a<1
[3] Other scholars are also encountering this idea of forgiveness. While working on this post, Kieron Flanagan pointed me to this recent post exploring the same concept prompted by a conversation we had the night before https://researchonresearchinstitute.substack.com/p/no-paper-is-perfect
[4] Weak-link models are already being used to understand the economic impact of AI: https://web.stanford.edu/~chadj/slides-automation.pdf
ACKNOWLDEGMENTS
I would like to thank Johannes Wachs, Jonathan Stieglitz, and Anna Sokolovska for useful comments.